Spring Boot 애플리케이션 모니터링: Prometheus + Grafana + Redis
들어가며
프로덕션 환경에서 애플리케이션의 상태를 실시간으로 모니터링하는 것은 매우 중요합니다. 특히 Redis를 활용한 Rate Limiting과 Refresh Token 관리가 포함된 시스템에서는 더욱 그렇죠.
이번 포스팅에서는 Spring Boot 애플리케이션에 Prometheus와 Grafana를 연동하여 실시간 모니터링 시스템을 구축한 과정을 공유합니다. 단순히 시스템 메트릭뿐만 아니라 Redis Health, Rate Limiting, Refresh Token Operations 등 커스텀 메트릭까지 포함한 완전한 모니터링 솔루션입니다.
왜 모니터링이 필요한가?
문제 상황
- 애플리케이션이 갑자기 느려졌는데 원인을 알 수 없음
- Redis 연결이 끊겼는지, Rate Limiting이 제대로 작동하는지 확인 불가
- 메모리 누수나 GC 문제를 사전에 감지하지 못함
- 사용자 불만이 발생한 후에야 문제를 인지
해결책
- 실시간 성능 메트릭 수집 및 시각화
- Redis 상태 및 커스텀 메트릭 모니터링
- 문제 발생 시 즉시 알림
- 과거 데이터 분석을 통한 트렌드 파악
아키텍처 개요

데이터 흐름:
- Spring Boot 애플리케이션이 Micrometer를 통해 메트릭을 노출
- Prometheus가 주기적으로 메트릭을 수집하여 저장
- Grafana가 Prometheus의 데이터를 시각화
1단계: Prometheus 설치 및 설정
1.1 Prometheus 설치 (Ubuntu)
# 사용자 생성
sudo useradd --no-create-home --shell /bin/false prometheus

# 디렉토리 생성
sudo mkdir /etc/prometheus
sudo mkdir /var/lib/prometheus

# Prometheus 다운로드
cd /tmp
wget https://github.com/prometheus/prometheus/releases/download/v2.48.0/prometheus-2.48.0.linux-amd64.tar.gz
tar -xvf prometheus-2.48.0.linux-amd64.tar.gz
cd prometheus-2.48.0.linux-amd64

# 파일 복사
sudo cp prometheus /usr/local/bin/
sudo cp promtool /usr/local/bin/
sudo cp -r consoles /etc/prometheus
sudo cp -r console_libraries /etc/prometheus

# 권한 설정
sudo chown -R prometheus:prometheus /etc/prometheus
sudo chown -R prometheus:prometheus /var/lib/prometheus
1.2 Prometheus 설정 파일
/etc/prometheus/prometheus.yml 파일을 생성합니다:
global:
  scrape_interval: 15s
  evaluation_interval: 15s
  external_labels:
    monitor: '[모니터링 명]'

scrape_configs:
  # Prometheus 자체 모니터링
  - job_name: 'prometheus'
    static_configs:
      - targets: ['localhost:9090']

  # Spring Boot 애플리케이션
  - job_name: '[job 이름]'
    metrics_path: '/actuator/prometheus'
    static_configs:
      - targets: ['localhost:8080']
        labels:
          application: '[application name]'
          environment: 'production'
    scrape_interval: 10s
    scrape_timeout: 5s
1.3 Systemd 서비스 등록
/etc/systemd/system/prometheus.service:
[Unit]
Description=Prometheus Monitoring System
After=network-online.target
Wants=network-online.target

[Service]
Type=simple
User=prometheus
ExecStart=/usr/local/bin/prometheus \
  --config.file=/etc/prometheus/prometheus.yml \
  --storage.tsdb.path=/var/lib/prometheus \
  --web.console.templates=/etc/prometheus/consoles \
  --web.console.libraries=/etc/prometheus/console_libraries \
  --web.listen-address=0.0.0.0:9090

Restart=always
RestartSec=5

[Install]
WantedBy=multi-user.target
서비스 시작:
sudo systemctl daemon-reload
sudo systemctl enable prometheus
sudo systemctl start prometheus
sudo systemctl status prometheus
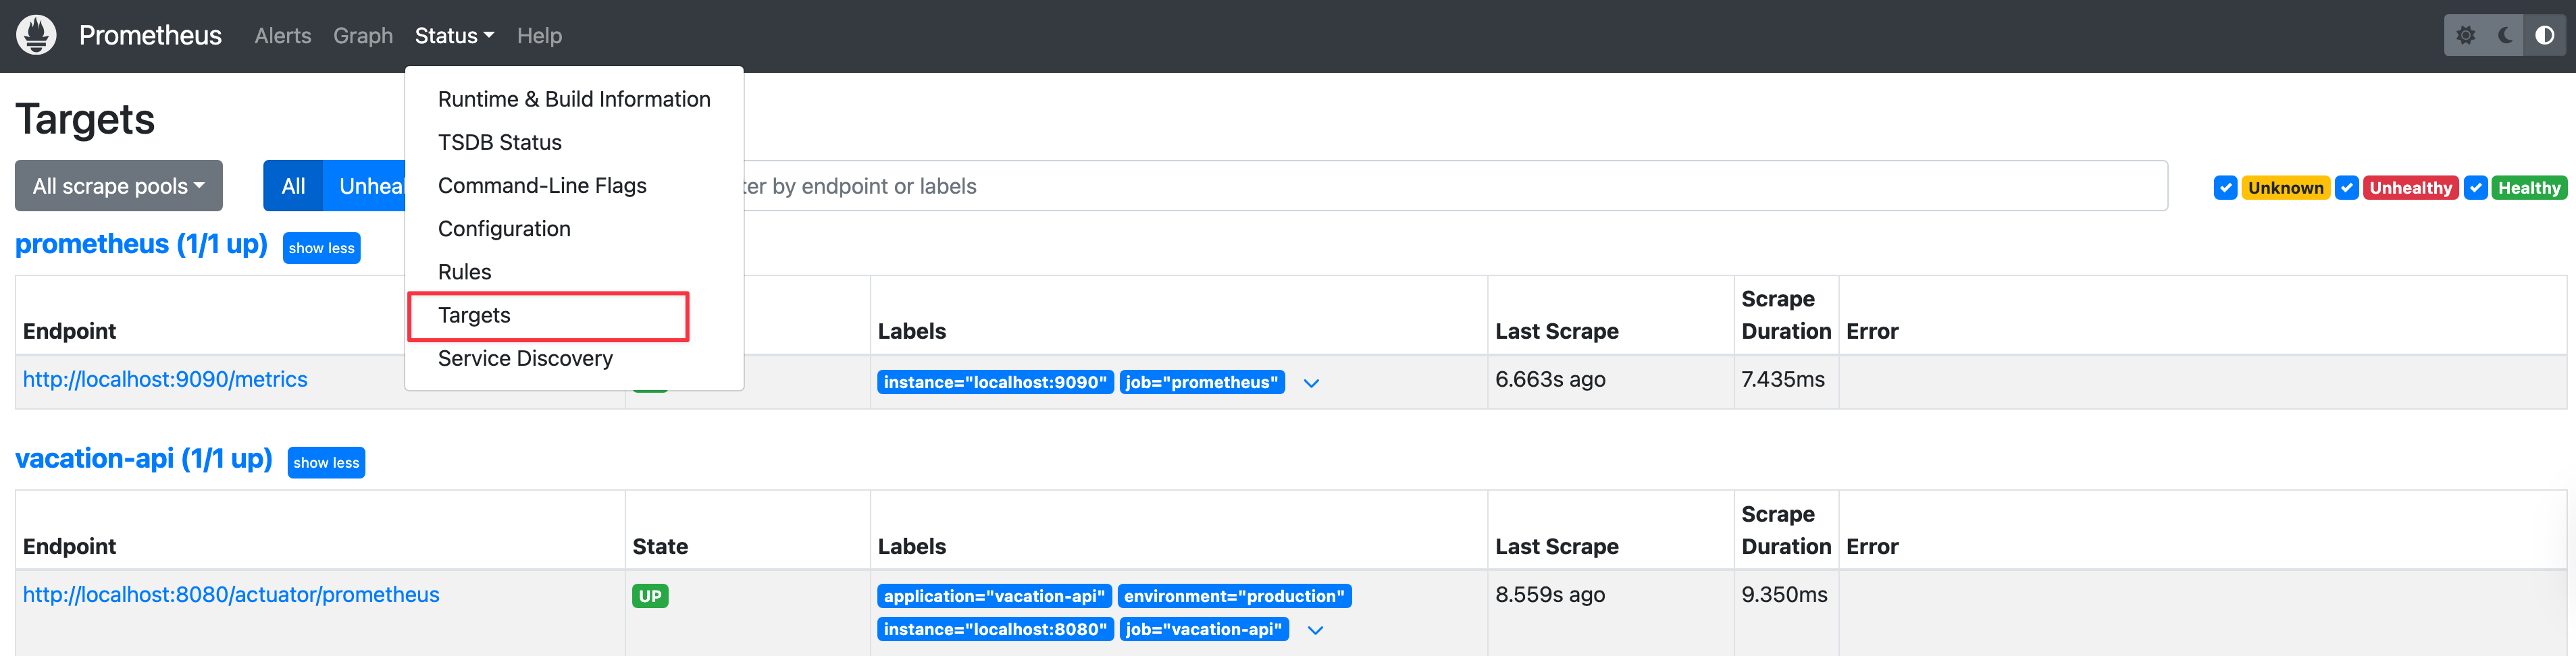
1.4 Prometheus Status 확인
접속: http://서버IP:9090 Target에서 확인
2단계: Grafana 설치 및 설정
2.1 Grafana 설치
# Grafana 저장소 추가
sudo apt-get install -y software-properties-common
sudo add-apt-repository "deb https://packages.grafana.com/oss/deb stable main"
wget -q -O - https://packages.grafana.com/gpg.key | sudo apt-key add -
sudo apt-get update
sudo apt-get install -y grafana

# 또는 수동 설치 (저장소 문제 시)
wget https://dl.grafana.com/oss/release/grafana_10.2.0_amd64.deb
sudo dpkg -i grafana_10.2.0_amd64.deb
2.2 포트 변경 (필요시)
기존 웹 애플리케이션이 3000 포트를 사용하는 경우:
sudo nano /etc/grafana/grafana.ini[server]
http_port = 3001 # 3000에서 3001로 변경2.3 Grafana 시작
sudo systemctl daemon-reload
sudo systemctl enable grafana-server
sudo systemctl start grafana-server
sudo systemctl status grafana-server
접속: http://서버IP:3001 (초기 로그인: admin / admin)
3단계: Spring Boot 애플리케이션 설정
3.1 의존성 추가
build.gradle:
dependencies {
    // Actuator
    implementation 'org.springframework.boot:spring-boot-starter-actuator'

    // Micrometer Prometheus 추가
    implementation 'io.micrometer:micrometer-registry-prometheus'
}
3.2 application-prod.yml 설정
management:
  endpoints:
    web:
      exposure:
        include: health,info,metrics,prometheus  # prometheus 추가
  endpoint:
    prometheus:
      enabled: true
  metrics:
    export:
      prometheus:
        enabled: true
    tags:
      application: ${spring.application.name}
      environment: ${spring.profiles.active}
    distribution:
      percentiles-histogram:
        http.server.requests: true
      percentiles:
        http.server.requests: 0.5, 0.95, 0.99
3.3 Security 설정 확인
SecurityConfig.java에서 /actuator/** 경로 허용:
@Configuration
@EnableWebSecurity
public class SecurityConfig {

    @Bean
    public SecurityFilterChain filterChain(HttpSecurity http) throws Exception {
        http
            .authorizeHttpRequests(auth -> auth
                .requestMatchers("/actuator/**").permitAll()  // Actuator 허용
                // ... 다른 설정들 ...
            );
        return http.build();
    }
}
4단계: 커스텀 메트릭 구현
4.1 Redis Health Monitor
Redis 연결 상태를 모니터링하는 서비스를 구현합니다:
@Service
@Slf4j
public class RedisHealthMonitor implements ApplicationRunner {

    private final RedisTemplate<String, String> redisTemplate;
    private final MeterRegistry meterRegistry;

    @Value("${spring.profiles.active}")
    private String activeProfile;

    private final Gauge redisHealthStatus;
    private final Counter redisHealthFailureCount;
    private final Counter redisHealthSuccessCount;

    public RedisHealthMonitor(RedisTemplate<String, String> redisTemplate,
                             MeterRegistry meterRegistry) {
        this.redisTemplate = redisTemplate;
        this.meterRegistry = meterRegistry;

        // 메트릭 등록
        this.redisHealthStatus = Gauge.builder("redis_health_status",
            () -> checkRedisHealth() ? 1.0 : 0.0)
            .description("Redis health status (1=UP, 0=DOWN)")
            .register(meterRegistry);

        this.redisHealthFailureCount = Counter.builder("redis_health_failure_count")
            .description("Redis health check failure count")
            .register(meterRegistry);

        this.redisHealthSuccessCount = Counter.builder("redis_health_success_count")
            .description("Redis health check success count")
            .register(meterRegistry);
    }

    @Override
    public void run(ApplicationArguments args) {
        if ("prod".equals(activeProfile)) {
            // 프로덕션 환경에서는 Redis 필수
            validateRedisConnection();
        }

        // 주기적으로 Redis 상태 확인
        ScheduledExecutorService scheduler = Executors.newScheduledThreadPool(1);
        scheduler.scheduleAtFixedRate(this::monitorRedisHealth, 0, 30, TimeUnit.SECONDS);
    }

    private boolean checkRedisHealth() {
        try {
            if (redisTemplate == null) {
                return false;
            }
            redisTemplate.execute((RedisCallback<String>) connection -> {
                connection.ping();
                return "PONG";
            });
            redisHealthSuccessCount.increment();
            return true;
        } catch (Exception e) {
            log.warn("Redis health check failed: {}", e.getMessage());
            redisHealthFailureCount.increment();
            return false;
        }
    }

    private void monitorRedisHealth() {
        boolean isHealthy = checkRedisHealth();
        log.debug("Redis health status: {}", isHealthy ? "UP" : "DOWN");
    }

    private void validateRedisConnection() {
        if (!checkRedisHealth()) {
            log.error("프로덕션 환경: Redis 연결 실패 - 애플리케이션 시작 중단");
            throw new IllegalStateException("Redis connection is required in production");
        }
    }
}
4.2 Rate Limiting 메트릭
Rate Limiting 서비스에 메트릭을 추가합니다:
@Service
@Slf4j
public class RateLimitingService {

    private final RedisTemplate<String, String> redisTemplate;
    private final Counter rateLimitExceededCounter;

    public RateLimitingService(RedisTemplate<String, String> redisTemplate,
                              MeterRegistry meterRegistry) {
        this.redisTemplate = redisTemplate;

        this.rateLimitExceededCounter = Counter.builder("rate_limit_exceeded_total")
            .description("Total number of rate limit exceeded")
            .register(meterRegistry);
    }

    public boolean isAllowed(String key, int maxRequests, Duration window) {
        // Rate limiting 로직...

        if (exceeded) {
            rateLimitExceededCounter.increment();
            return false;
        }
        return true;
    }
}
4.3 Refresh Token 메트릭
Refresh Token 서비스에 메트릭을 추가합니다:
@Service
@Slf4j
public class RefreshTokenService {

    private final RedisTemplate<String, String> redisTemplate;
    private final Counter refreshTokenOperationCounter;
    private final Timer refreshTokenOperationTimer;

    public RefreshTokenService(RedisTemplate<String, String> redisTemplate,
                              MeterRegistry meterRegistry) {
        this.redisTemplate = redisTemplate;

        this.refreshTokenOperationCounter = Counter.builder("refresh_token_operation_total")
            .description("Total refresh token operations")
            .tag("operation", "unknown")
            .register(meterRegistry);

        this.refreshTokenOperationTimer = Timer.builder("refresh_token_operation_duration_seconds")
            .description("Refresh token operation duration")
            .register(meterRegistry);
    }

    public void saveRefreshToken(String userId, String refreshToken) {
        Timer.Sample sample = Timer.start(meterRegistry);
        try {
            // Refresh token 저장 로직...
            refreshTokenOperationCounter.increment(
                Tags.of("operation", "save")
            );
        } finally {
            sample.stop(refreshTokenOperationTimer);
        }
    }

    public String getRefreshToken(String userId) {
        Timer.Sample sample = Timer.start(meterRegistry);
        try {
            // Refresh token 조회 로직...
            refreshTokenOperationCounter.increment(
                Tags.of("operation", "get")
            );
            return token;
        } finally {
            sample.stop(refreshTokenOperationTimer);
        }
    }
}
5단계: Grafana 대시보드 구성
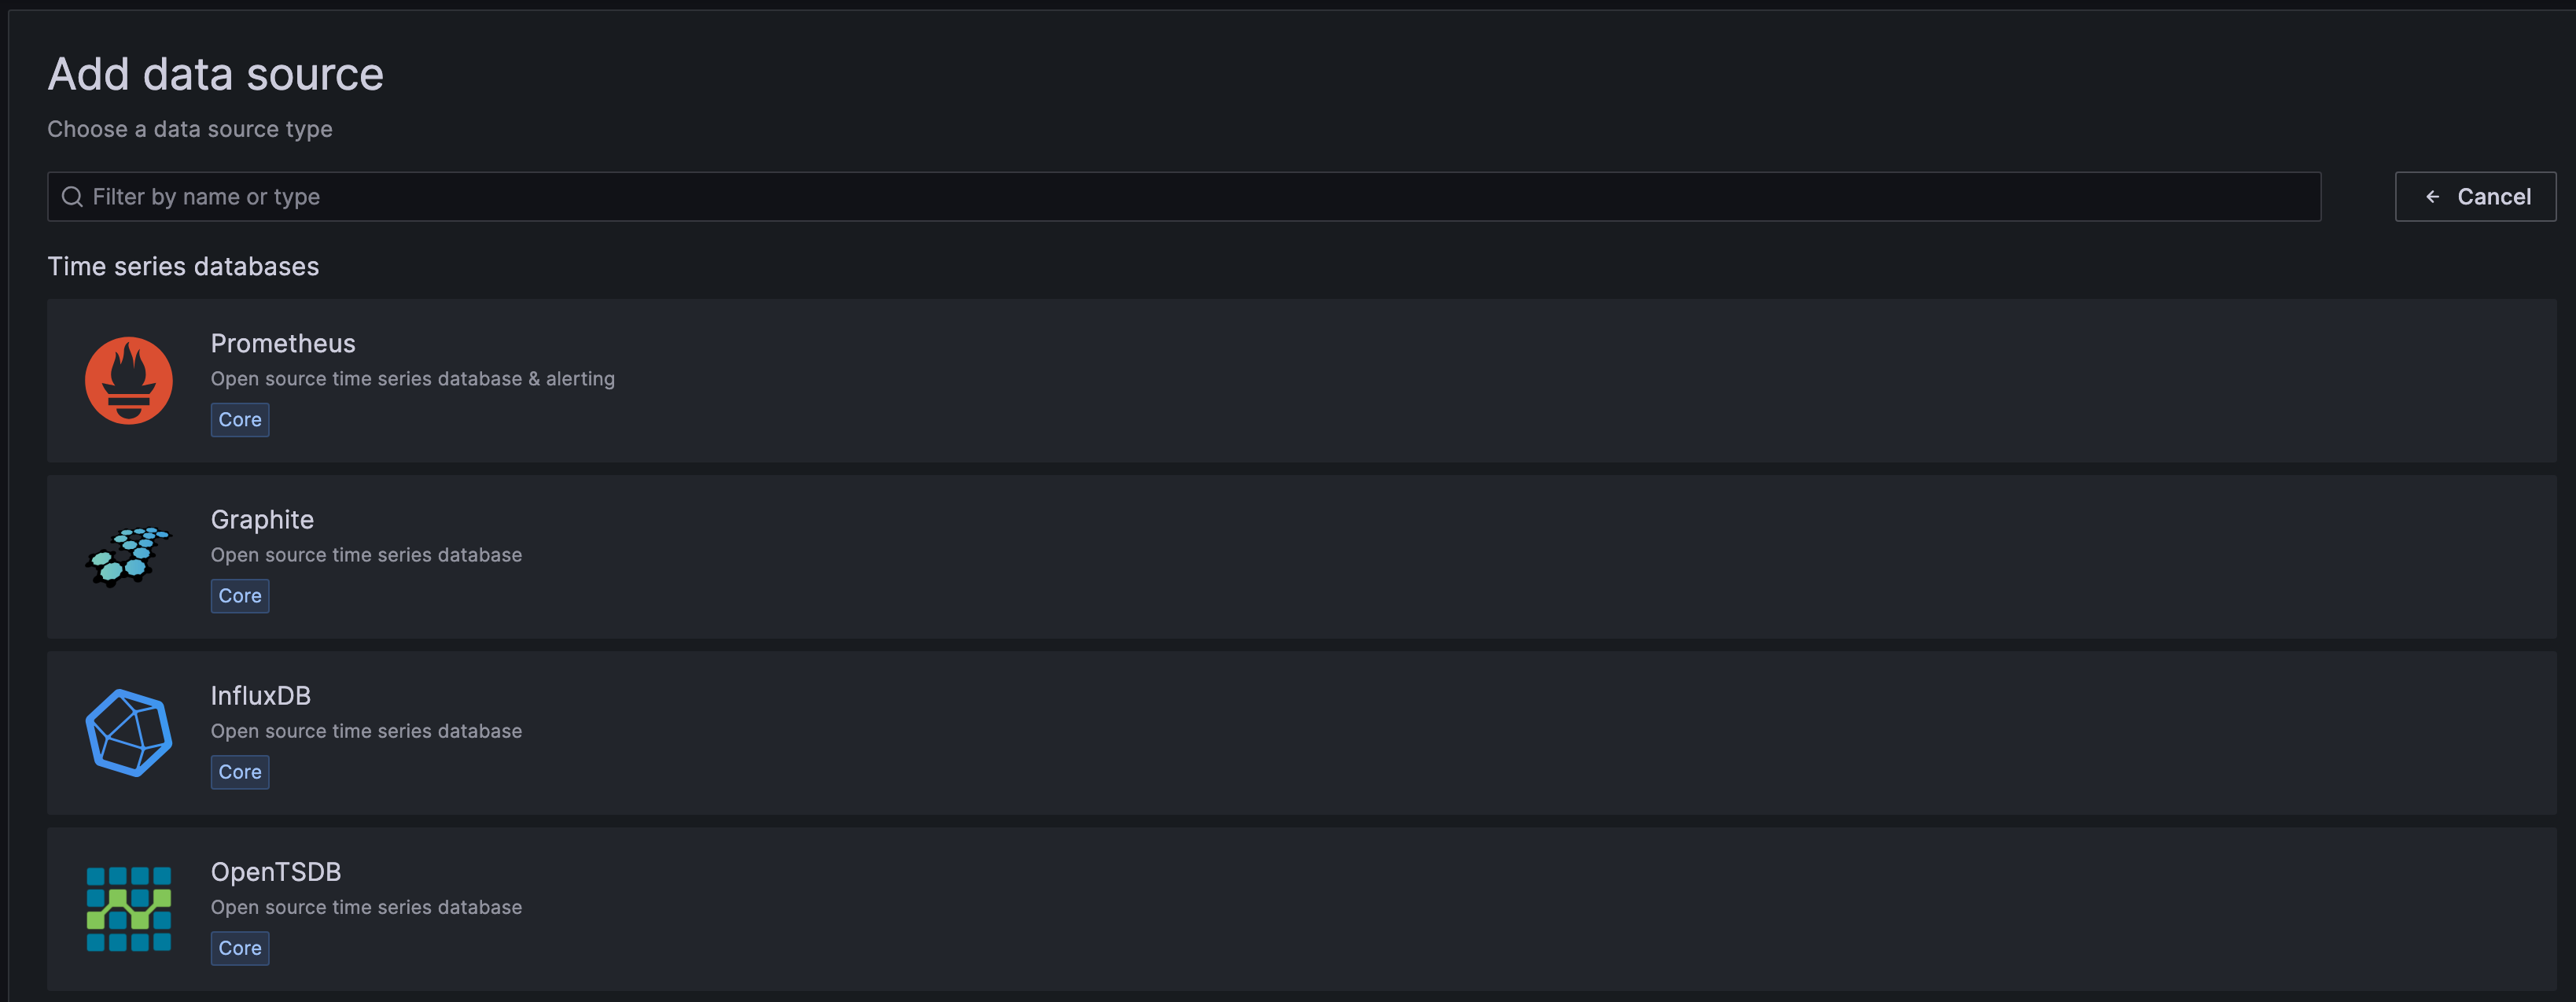
5.1 Prometheus 데이터 소스 연결
- Grafana 접속:
http://서버IP:3001 - Configuration → Data Sources → Add data source
- Prometheus 선택
- URL:
http://localhost:9090 - Save & Test 클릭


5.2 Spring Boot APM 대시보드 임포트
- Dashboards → Import
- Spring Boot APM 대시보드 JSON 파일 업로드
- Prometheus 데이터 소스 선택
- Import 클릭


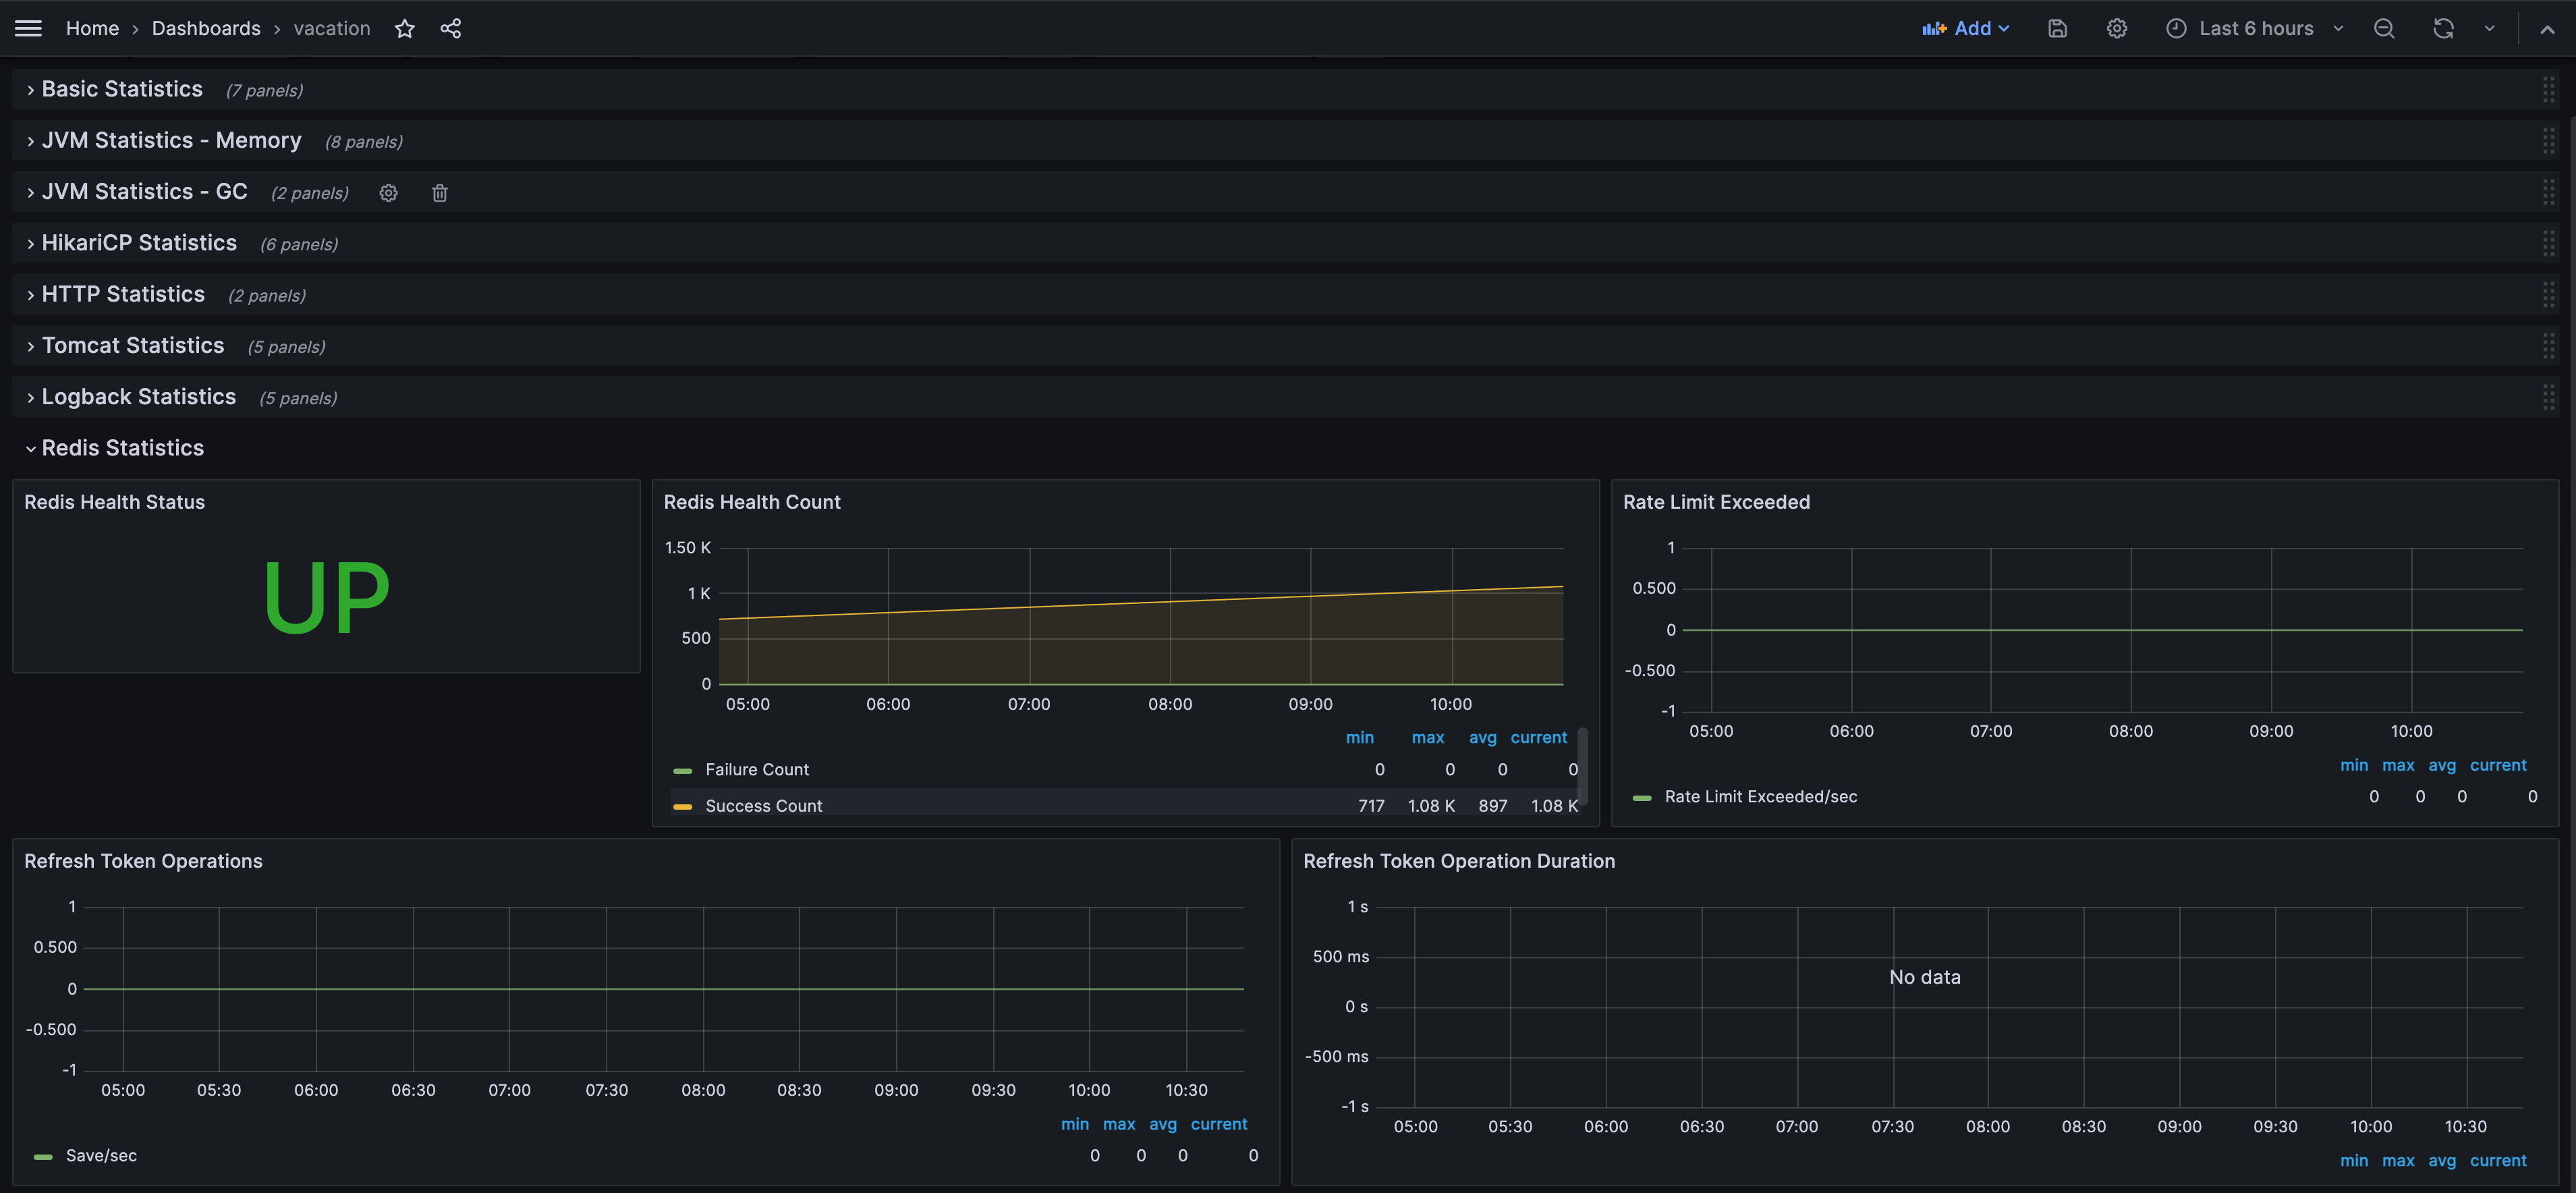
5.3 Redis 모니터링 패널 추가
다음과 같은 Redis 전용 패널들을 추가합니다:
Redis Health Status
- 타입: Stat
- 쿼리:
redis_health_status - 표시: UP/DOWN 상태
Redis Health Count
- 타입: Graph
- 쿼리:
redis_health_failure_countredis_health_success_count
Rate Limit Exceeded
- 타입: Graph
- 쿼리:
irate(rate_limit_exceeded_total[5m])
Refresh Token Operations
- 타입: Graph
- 쿼리:
irate(refresh_token_operation_total{operation="save"}[5m])irate(refresh_token_operation_total{operation="get"}[5m])irate(refresh_token_operation_total{operation="delete"}[5m])
Refresh Token Operation Duration
- 타입: Graph
- 쿼리:
histogram_quantile(0.95, irate(refresh_token_operation_duration_seconds_bucket[5m]))histogram_quantile(0.50, irate(refresh_token_operation_duration_seconds_bucket[5m]))
모니터링 가능한 메트릭
시스템 메트릭
- CPU 사용률 (System/Process)
- 메모리 사용량 (Heap/Non-Heap)
- JVM 통계 (GC, Threads, Classes)
- 파일 디스크립터
애플리케이션 메트릭
- HTTP 요청 수 및 응답 시간
- HikariCP 커넥션 풀 상태
- Tomcat 세션 및 스레드
- Logback 로그 레벨별 카운트
커스텀 메트릭 (Redis 관련)
- Redis Health Status (UP/DOWN)
- Redis Health Count (Success/Failure)
- Rate Limit Exceeded (초당 초과 횟수)
- Refresh Token Operations (Save/Get/Delete 초당 횟수)
- Refresh Token Operation Duration (95th, 50th percentile)
결과 및 효과
Before (모니터링 전)
- 문제 발생 시 원인 파악에 시간이 오래 걸림
- Redis 연결 상태를 확인할 방법이 없음
- Rate Limiting이 제대로 작동하는지 확인 불가
- 성능 저하를 사전에 감지하지 못함
After (모니터링 후)
- 실시간으로 애플리케이션 상태 확인 가능
- Redis Health Status를 한눈에 확인
- Rate Limiting 및 Refresh Token 사용량 추적
- 문제 발생 시 즉시 알림 가능
- 과거 데이터 분석을 통한 트렌드 파악
실제 활용 사례
- Redis 연결 문제 조기 발견: Health Status가 DOWN으로 변경되면 즉시 알림
- Rate Limiting 효과 확인: 초과 횟수를 모니터링하여 적절한 임계값 설정
- 성능 최적화: Refresh Token Operation Duration을 통해 병목 지점 파악
- 용량 계획: 메모리 사용량 트렌드를 분석하여 서버 증설 시점 결정
트러블슈팅
Prometheus 타겟이 DOWN인 경우
- 애플리케이션 실행 확인
curl http://localhost:8080/actuator/prometheus- Prometheus 설정 확인
prometheus.yml의targets주소 확인- 방화벽 설정 확인
- 애플리케이션 로그 확인
/actuator/prometheus엔드포인트 접근 로그 확인
Grafana에서 데이터가 보이지 않는 경우
- Prometheus 데이터 소스 연결 확인
- Grafana → Configuration → Data Sources
- "Test" 버튼으로 연결 확인
- 메트릭 이름 확인
- Prometheus UI (
http://서버IP:9090)에서 메트릭 목록 확인 - Grafana 쿼리에서 정확한 메트릭 이름 사용
- Prometheus UI (
- 시간 범위 확인
- Grafana 대시보드의 시간 범위 설정 확인
마무리
이번 포스팅에서는 Spring Boot 애플리케이션에 Prometheus와 Grafana를 연동하여 완전한 모니터링 시스템을 구축하는 방법을 공유했습니다.
특히 Redis Health, Rate Limiting, Refresh Token Operations 등 비즈니스 로직과 밀접한 커스텀 메트릭을 구현하여 단순한 시스템 메트릭을 넘어서는 실용적인 모니터링 솔루션을 만들었습니다.
모니터링은 단순히 "보는 것"이 아니라, 문제를 예방하고, 빠르게 대응하며, 지속적으로 개선하기 위한 도구입니다. 이번 구축을 통해 더 안정적이고 신뢰할 수 있는 서비스를 제공할 수 있게 되었습니다.
참고 자료:
'Tool' 카테고리의 다른 글
| Charles로 백엔드 요청 분석하고 재현하는 방법 (0) | 2025.04.10 |
|---|---|
| Raycast: Mac Spotlight 대체하기 (2) | 2024.11.29 |

